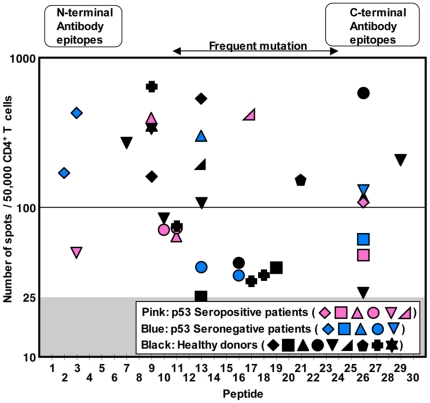
Figure 4. Distribution of CD4+ T cell epitopes in ovarian cancer patients and healthy donors.
The magnitude of CD4+ T cell responses in ovarian cancer patients with or without p53-specific serum antibody and healthy donors against p53 overlapping peptides is plotted. Each symbol represents one individual. All responses shown were significant as compared to the number of background spots. 6/12 seropositive (pink symbols) and 5/10 seronegative (blue symbols) ovarian cancer patients and 9/12 healthy individuals (black symbols) showed positive CD4+ T cell responses against p53 peptide-pulsed target cells compared with unpulsed target cells.

