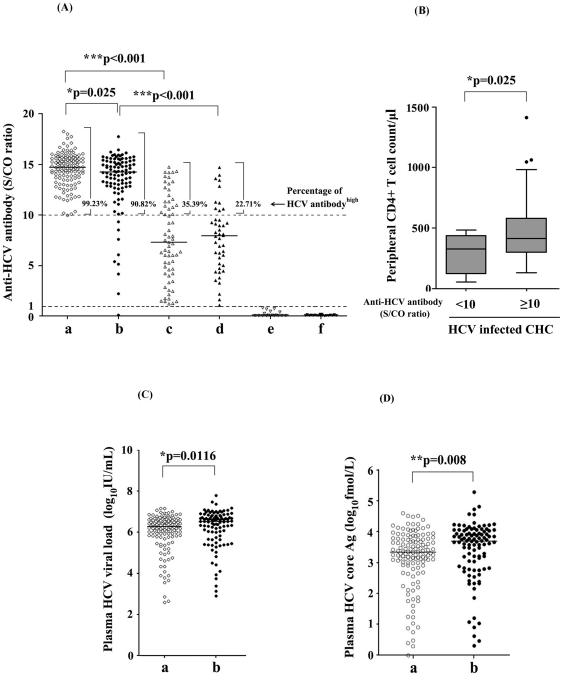
Figure 3. S/CO ratio of anti-HCV antibody, plasma HCV viral load and concentration of plasma HCV core antigen were analyzed among five HCV- and/or HIV-infected groups and healthy controls.
(A) S/CO ratio of anti-HCV antibody. S/CO ratio was shown as a scatter dot plot graph. Values (S/CO) no less than 10 were considered as HCV antibodyhigh and percentages of patients with HCV antibodyhigh were indicated for each group. (B) CD4+ T cells counts in HIV-infected CHC subpopulations based on the level of anti-HCV antibody titer (S/CO). (C) Plasma HCV viral load in HIV-1-noninfected CHC and HIV-infected CHC patients. (D) Concentration of plasma HCV core antigen in HIV-noninfected CHC and HIV-infected CHC patients. Group a (○), b(•),c(△),d(▴),e (▽) and f(▾) indicated participants of HIV-noninfected CHC, HIV-infected CHC, HIV-noninfected SVC, HIV-infected SVC, HIV-monoinfected patients and healthy controls respectively. Median was shown as a horizontal bar in each group. Mann-Whitney U-tests were performed for statistical comparison between two different groups. Single asterisk (*) indicate P values below 0.05. Double asterisks (**) indicate P values below 0.01 and triple asterisks (***) indicate P values below 0.001.

