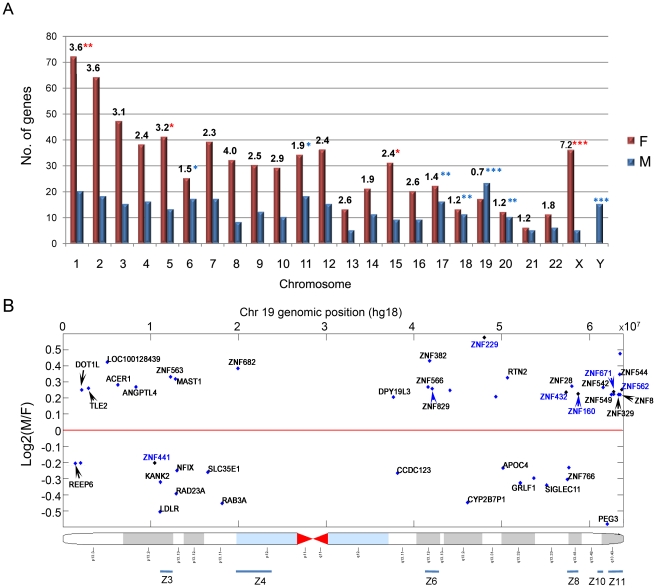
Figure 1. Chromosomal distribution of male-biased and female-biased genes identified in human liver.
(A) Number of male- and female-biased genes on each chromosome, based on the criteria |fold change|≥1.15 and composite array score ≥14. Numbers at the top of each bar indicate the ratio of the number of female-biased genes to male-biased genes on each chromosome. Asterisks indicate the significance of the sex ratio based on Chi-square tests (*p<0.05; **p<0.01; ***p<0.001; red asterisks indicate significant enrichment of female-biased genes and blue asterisks indicate significant enrichment of male-biased genes). (B) Log2 male/female expression ratios for sex-biased genes on chromosome 19 vs. chromosomal location, based on genome release hg18. Blue bars at the bottom mark six previously defined ZNF gene clusters [40] that contain 13 sex-biased ZNFs in human liver; these ZNF genes show an enrichment score of ∼2.0 relative to the total number of ZNF genes on chromosome 19. An additional 6 sex-biased ZNF genes with a composite array score of 13 (Table S2C) are included, and marked with gene names shown in blue.

