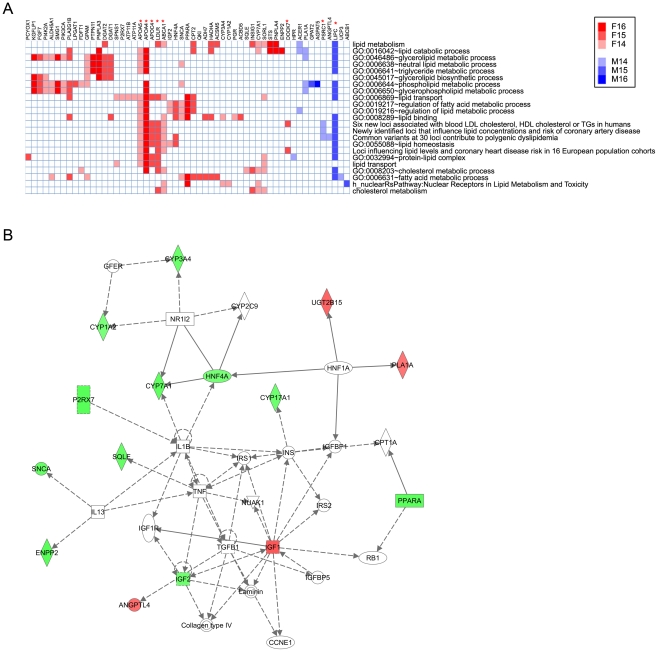
Figure 3. Association of sex-biased genes with lipid metabolism.
(A) Heat map of 55 sex-biased genes associated with lipid metabolism with the 23 functional terms identified by DAVID analysis whose enrichment p-values are <1E-5. Each row represents a functional term and each column represents a gene, as marked at the top. Red, female-biased genes; blue, male-biased genes, with greater color intensity used to indicate genes with higher composite array scores, as shown in the color bar scale. Red asterisks mark 8 genes involved in polygenic dyslipidemia and cardiovascular disease as determined by GWAS [24], [45]. See Table S3B for a complete listing of 81 genes associated with lipid metabolism and the 57 corresponding functional terms. (B) Top network associated with sex-biased genes involved in lipid metabolism, as determined by Ingenuity Pathway Analysis. Other top networks are shown in Fig. S4.

