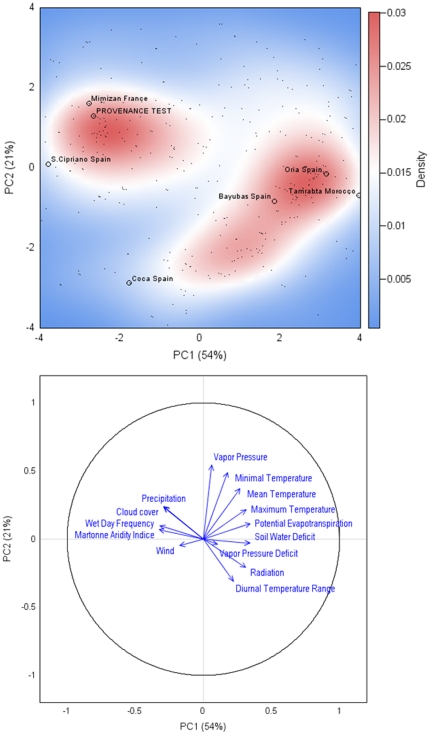
Figure 1. Principal component analysis (PCA) on the [763 population locations x 14 climatic variables] data matrix.
Upper panel: The contour plot represents the presence's probability (kernel density estimate) of Pinus pinaster population (small black dot) within the bioclimatic envelope representing by PC1 and PC2 axes, accounted for 54% and 21% of the variance, respectively. The studied populations and provenance test are indicated by black circles. PCA was performed with the variables indicated in the methods section. See Table S2, for additional information about the relative contribution of climatic variables to the axes. Lower panel: projection of 14 climatic variables on the subspace spanned by the first two eigenvectors (correlation circle).

