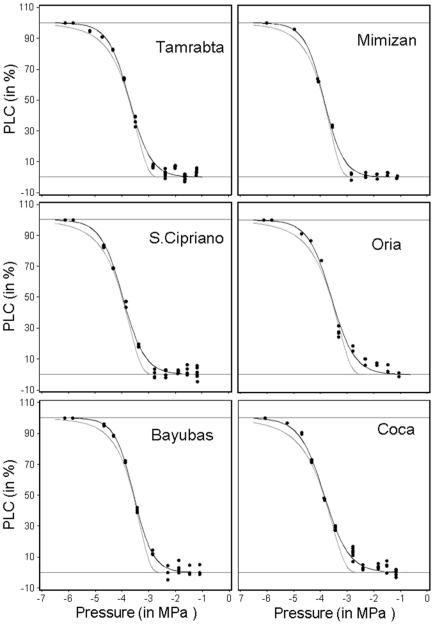
Figure 2. Vulnerability curves of one genotype for each studied population.
Black dot are the raw measure of percent of loss of conductance (PLC in %) along the negative pressure gradient (in MPa). The grey line is the Weibull reparameterized model and the black line is the sigmoid reparameterized Model.

