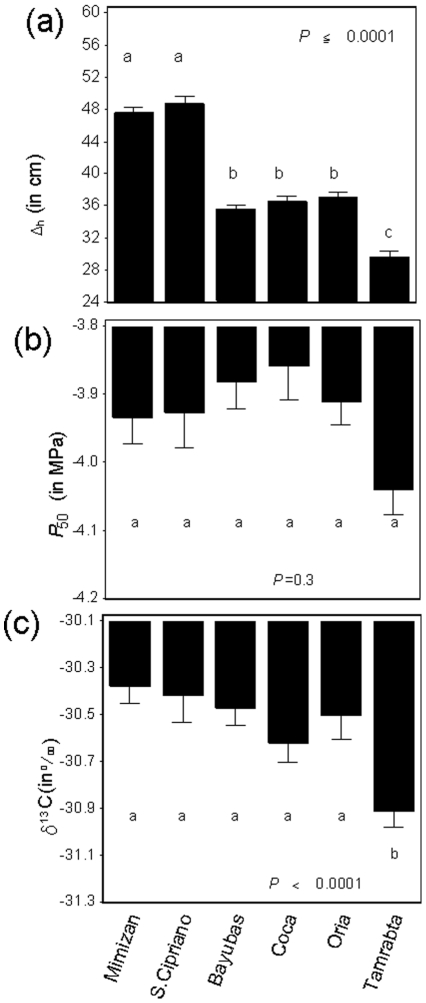
Figure 3. Mean values of height increment (Δh, (a)) (n = 297 per population).
Mean values of cavitation resistance (P 50, (b)) and carbon isotope composition (δ13C, (c)) for each studied population (n = 40 per population). The error bars represents the standard errors. Different letters indicate significant differences between populations at α = 0.05.

