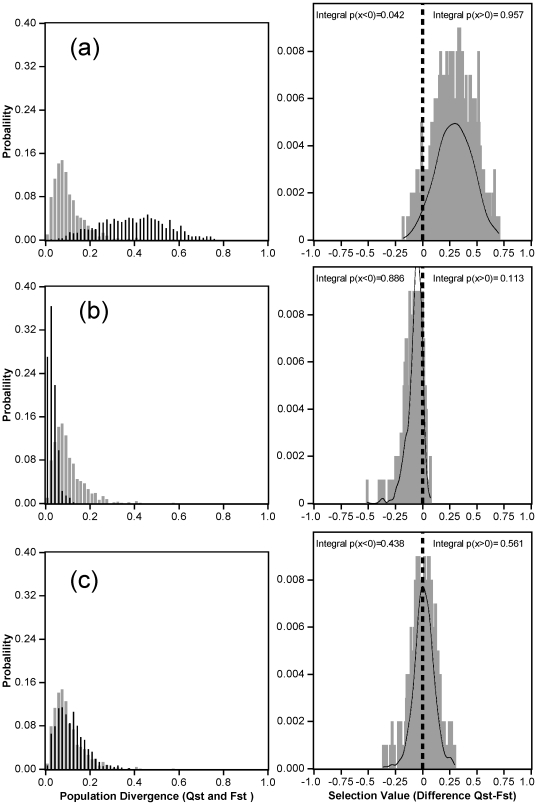
Figure 4. Comparison between F ST (histogram in gray) and Q ST (histogram in black) distributions for growth rate (Δh, (a)), cavitation resistance (P 50, (b)) and carbon isotope composition (δ 13C, (c)) in the left panel.
The observed distribution (gray histogram) and the kernel density (black curves) of the Q ST-F ST difference are represented in the right panel for each trait. On the right panel, we also show the integral probability of the distribution (using the kernel density estimator) above (see “Integral p(x>0)” on the right panel) and below (see “Integral p(x<0)” on the right panel) zero (marked with the tick and dotted line).

