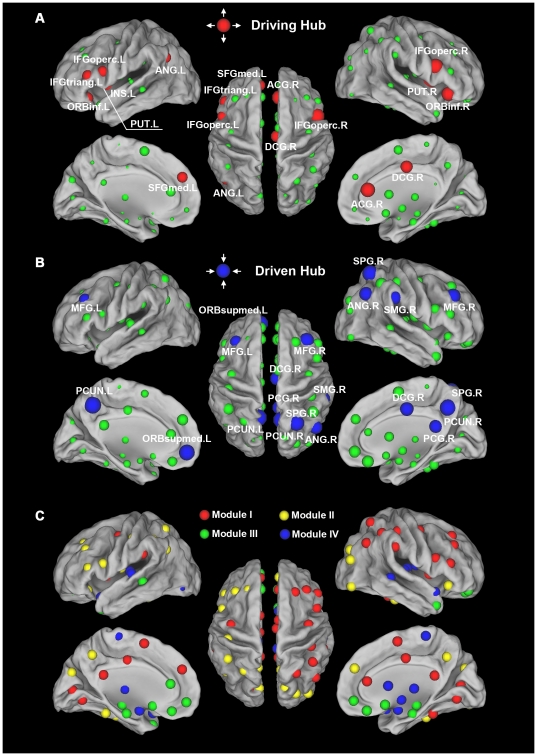
Figure 6. Hub distribution and modular architecture of the human brain functional directed network at strongly connected (SC) threshold.
(A) Regions with out-degree  >mean+SD are considered driving hubs (red colors) or non-hubs (green colors) otherwise. (B) Regions with in-degree
  >mean+SD are considered driven hubs (blue colors) or non-hubs (green colors) otherwise. (C) All of the 90 brain regions are marked with different colored spheres (different colors represent distinct network modules) and further mapped onto the cortical surfaces using the Caret software [94]. For the abbreviations of the regions, see Table S1.

