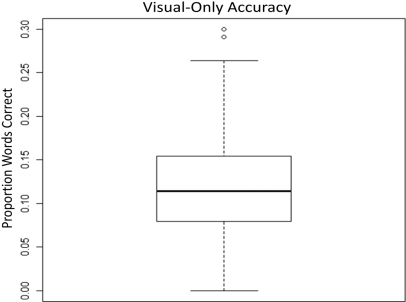
Figure 1.
The line in the middle of the box shows the mean visual-only sentence recognition score across all 84 participants. The 75th and 25th percentile are represented by the line above and below the middle line, respectively. The small bars on the top and bottom denote a value of 1.5 times the interquartile range.

