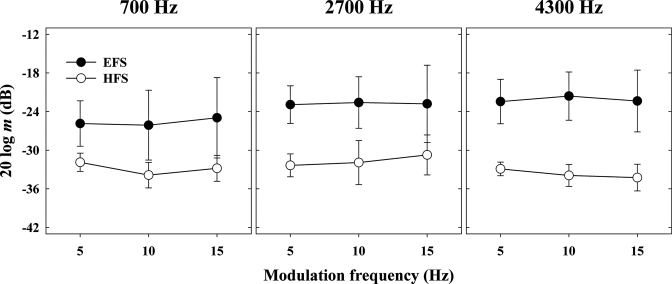
Figure 2.
Averaged modulation detection thresholds as a function of the modulation frequency. Each panel corresponds to results when a given carrier frequency was the modulated carrier. The circles and squares correspond to the EFS and the HFS condition, respectively. Errors bars indicate ± one standard deviation.

