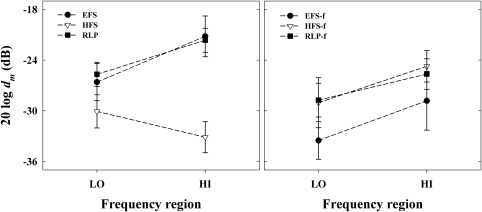
Figure 6.
Averaged modulation detection thresholds as a function of the frequency region of the carriers. Left panel shows the thresholds for unfiltered stimuli. Right panel shows the thresholds for the same stimuli filtered using a 128-Hz band-pass filter centered at the original modulated carrier.

