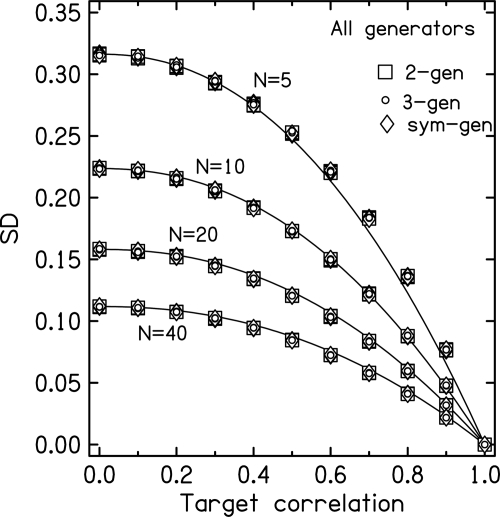
Figure 2.
The standard deviation, SD, of the correlation from numerical models for all three generators as a function of the target correlation. Parameter N is the number of spectral components in the noise, equal to the product of the bandwidth and the duration. Symbols show the mean SD for 100000 trials using Rayleigh-distributed amplitudes with the weak equal-power assumption. Each symbol is actually plotted four times because the numerical experiments were performed four times with different random starts. However, the individual symbols cannot be distinguished because they overlap. The solid lines show the fit to the formula in Eq. 19.

