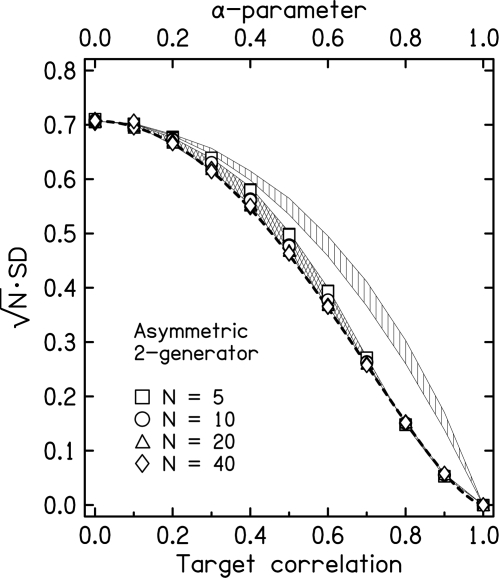
Figure 3.
The standard deviation, SD, from the asymmetric two-generator method, plotted as SD. Parameter N is the number of spectral components in the noise. Symbols show the results for 100 000 trials using Rayleigh-distributed amplitudes with the strong equal-power assumption. The symbols for N = 20 and N = 40 overlap; N = 20 is asymptotically large; no change would be expected for N > 40. Each symbol is actually plotted four times because the numerical experiments were performed four times with different random starts, but the individual symbols cannot be distinguished. The cross-hatched region shows the result of setting all the amplitudes equal to 1.0. It is bounded by the standard deviations for N = 5 on the top and N = 40 on the bottom. The heavy dashed line shows the large-N prediction from the model based on the normal distribution, Eqs. 23, 24. For α = 0, its limit is 1∕. The vertically hatched region shows the results for the weak equal-power case, replotted from Fig. 2. The vertical extent of the region again indicates the range for N = 5 to N = 40. The vertically hatched region is characteristic of all the generators discussed in this article.

