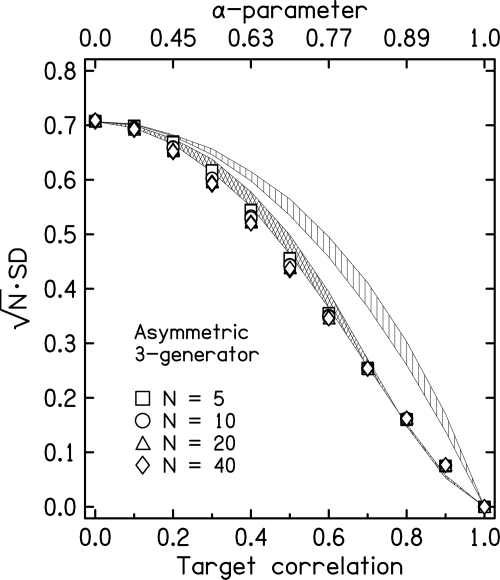
Figure 4.
Standard deviation for the three-generator method with the strong equal-power assumption plotted as SD. The cross-hatched region shows the results for the two-generator method from Fig. 3 for comparison. The top of the cross-hatched region corresponds to N = 5, and the bottom of the region corresponds to N = 40. Both the target-correlation and α-parameter axes apply to the three-generator data. Only the target-correlation axis applies to the two-generator data. The vertically hatched region shows the results for the weak equal-power case, replotted from Fig. 2. The vertical extent of the region again indicates the range for N = 5 to N = 40.

