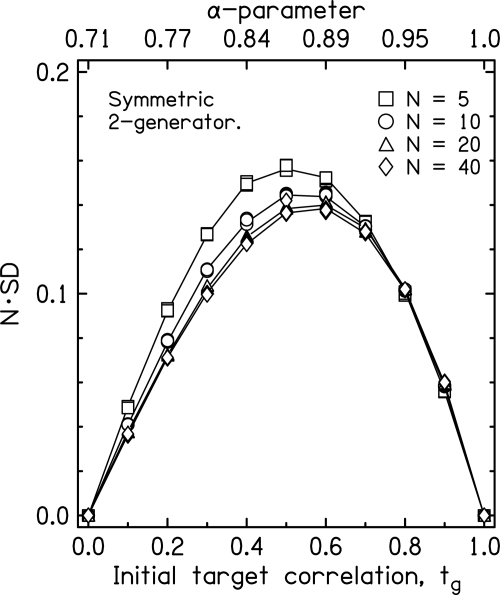
Figure 5.
Symbols show the standard deviations, SD, computed for the symmetric generator, plotted as N · SD, as a function of the initial target value tg. Each symbol actually appears four times, representing four different random starts of the numerical experiment. The very small values of SD are a result of the strong equal-power assumption.

