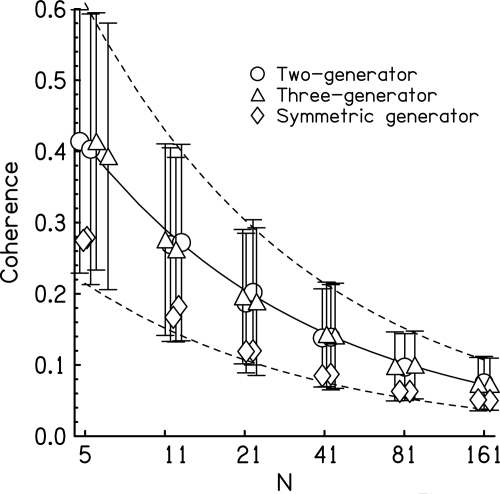
Figure 6.
Computed coherence for finite-lag correlation as a function of the number of spectral components when the target coherence is zero. Five hundred waveforms were computed for the three different generators. Symbols show the average, and error bars are two standard deviations in overall length. Symbols are in pairs illustrating two different random starts. They are slightly jogged horizontally for clarity. The solid line is the function 0.92∕, and the dashed lines are the same function plus and minus 0.44∕.

