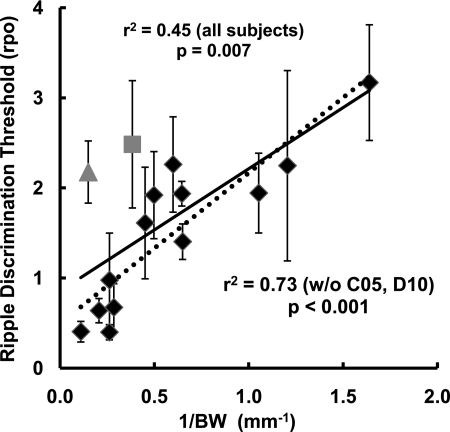
Figure 5.
Octave-band ripple discrimination (from Experiment 2) as a function of transformed STC bandwidth. Data from all subjects are included in the solid regression line; subjects C05 and D10 are identified with different symbol shapes. Data from 13 subjects, excluding C05 and D10, are included in the dotted regression line.

