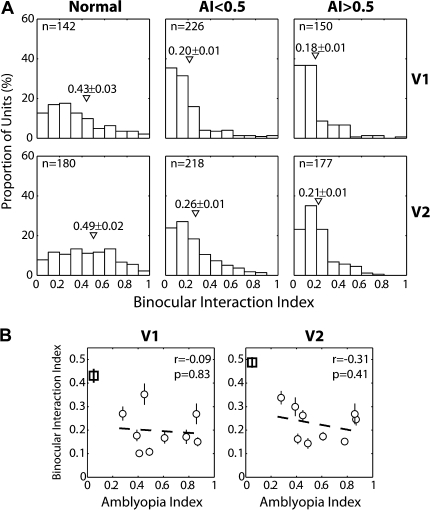
Figure 11.
(A) Histograms illustrating the distribution of binocular interaction index (BII) values for V1 (top) and V2 (bottom) neurons in normal (left), mildly amblyopic (middle) and severely amblyopic monkeys (right). (B) Relationships between the average BIIs of V1 (left) and V2 (right) neurons for individual monkeys and the depth of their amblyopia (AI). Square symbols indicate the mean BII of normal monkeys.

