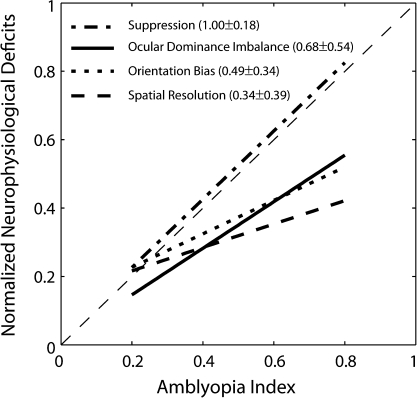
Figure 13.
Comparisons of the relative magnitude of V2 deficits with the depth of amblyopia (AI). The proportions of binocularly suppressive unit, the ocular dominance imbalance (ROII), the average spatial resolution, and the average orientation bias of V2 neurons in individual monkeys were first normalized to the respective maximum value and then were fit to obtain a regression line for each V2 deficit. The slope (±standard error of the mean) is given for each function.

