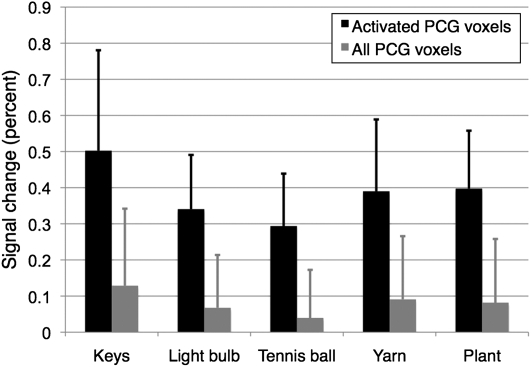
Figure 2.
Percent signal change induced by the individual clips within the postcentral gyrus. The gray bars represent the signal changes induced within the entire mask (which was obtained by warping all individual anatomical masks into the standard space and then including those voxels that were present in at least 3 subjects). The black bars represent the signal changes induced in a subregion of the postcentral gyrus mask limited to the voxels that were significantly activated in the overall contrast of touch observation versus fixation, as shown in Figure 1. Error bars represent the standard deviation. PCG: postcentral gyrus.

