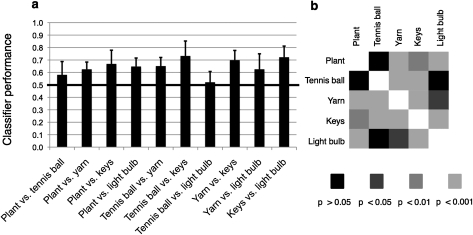
Figure 4.
Classifier performance on 2-way discrimination tasks. (a) Each bar represents classifier performance on a 2-way discrimination task, averaged across all 8 subjects. Error bars represent the standard deviation. (b) Levels of significance of all 2-way discrimination tasks (2-tailed t-tests, n = 8).

