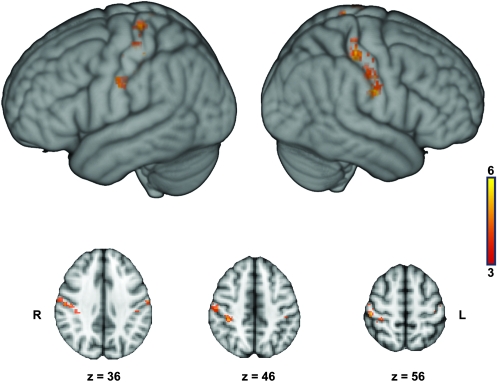
Figure 6.
Group-level sensitivity map, representing the overlap of the 5% most discriminative voxels in individual subjects, after warping the individual subject maps into the standard space (see Materials and Methods). The color code denotes the number of subjects in whom a certain voxel surpassed the threshold criterion. It is obvious that a majority of the most discriminative voxels was located in the right hemisphere, in accordance with the asymmetry in classifier performance. It is also obvious, especially on the axial cuts, that most of these voxels are clustered on the posterior wall of the postcentral gyrus and in the postcentral sulcus, corresponding mainly to BA 2. On the axial cuts, the right hemisphere is displayed on the left side of the image and vice versa.

