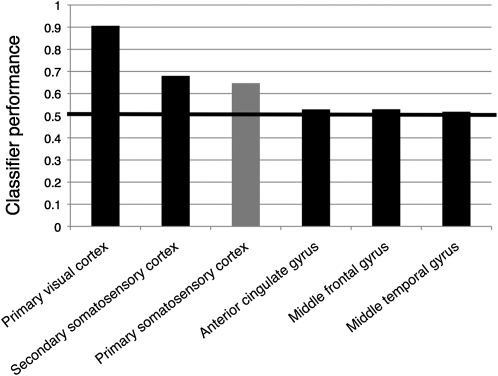
Figure 7.
Classifier performance outside the primary somatosensory cortex. The bars represent classifier performance averaged across all subjects and all 2-way discriminations for the target mask in primary somatosensory cortex (gray bar) and for control masks in primary visual cortex, secondary somatosensory cortex, anterior cingulate cortex, middle frontal gyrus, and middle temporal gyrus (black bars). The control masks were adjusted in size to the somatosensory target mask (see Materials and Methods).

