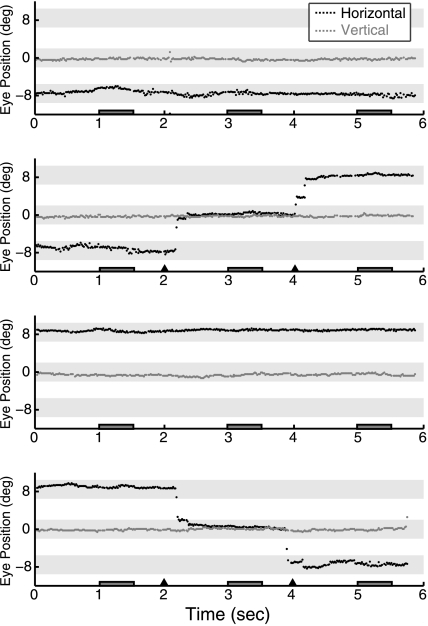
Figure 2.
Sample eye traces. Eye traces are shown for a single representative subject on 4 consecutive trials of Experiment 1. Horizontal and vertical eye position are plotted in degrees with zero indicating the center of the screen. Vertical eye position always remained at center. On half of the trials horizontal eye position also remained stable, at either the left fixation position (panel 1) or right fixation position (panel 3). On the other half of the trials, a series of horizontal eye movements was made from left to middle to right positions (panel 2) or right to middle to left (panel 4). Eye position over the full 6 s trial is shown. Dark gray boxes along the x-axis indicate the 3 stimulus periods on each trial, and triangles indicate fixation location changes on saccade trials. Light gray shading illustrates the fixation locations ±2 degrees: that is, the fixation window that subjects needed to remain within for successful fixation.

