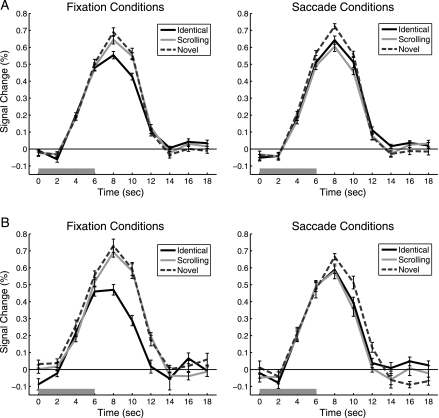
Figure 3.
PPA Timecourses. FIR timecourses are shown for each of the 3 Fixation conditions and Saccade conditions. (A) Experiment 1, N = 12. (B) Experiment 2, N = 10. The 6-s trial stimulation period is indicated by the gray bar. Error bars are standard error of the mean after normalization to remove between-subject variability at each timepoint (Loftus and Masson 1994).

