Fig. 2.
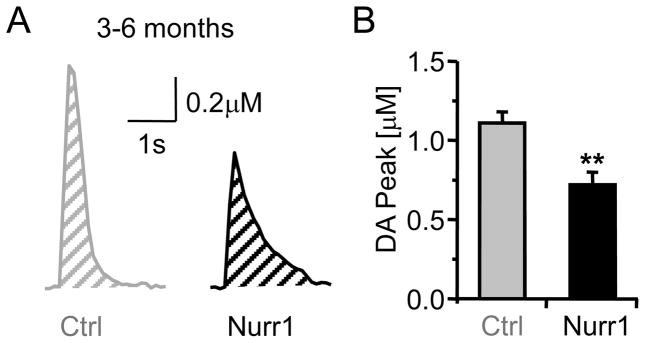
Single-pulse (lp) evoked DA release in Nurr1 +/+ (Ctrl) and Nurr1 +/− (Nurr1) mice (3–6 months) slices from the dorsal striatum. (A) Representative DA signals from controls (Ctrl, gray) and Nurr1 mice (black). The evoked DA signal from Nurr1 mice was smaller in peak amplitude and showed a prolonged decay phase compared to the control. (B) Mean amplitude of the DA signal in Nurr1 mice and the control (n = 30, 38 respectively; ** p < 0.01).

