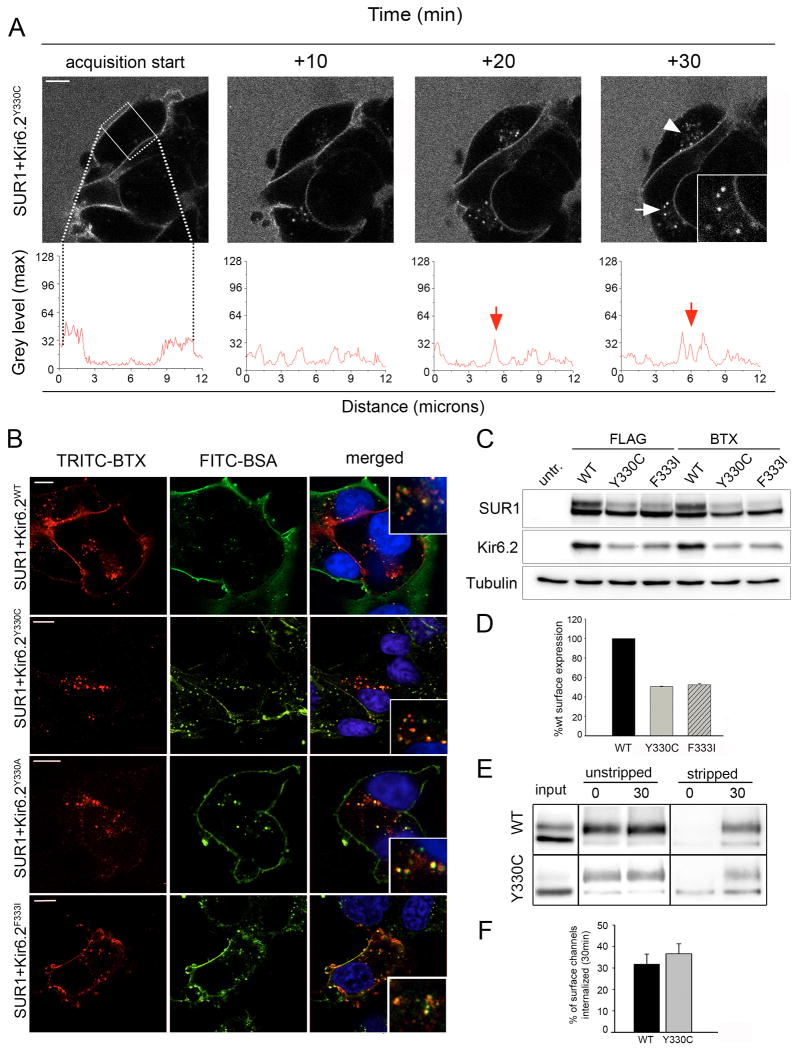
Figure 2. Analysis of Kir6.2 mutants with disrupted 330YSKF333motif.
(A) The Kir6.2 mutant Y330C shows robust internalization when monitored by time-lapse imaging. Distribution of surface and internalized channels is displayed using line scan (compare screen shots, white arrowheads and inset, scale bar 5 μm, line scan below). (B) COSm6 cells labeled with TRITC-BTX at 4°C and chased for 30min at 37°C with media containing FITC-BSA. Cells expressing BTX tag-SUR1 and WT Kir6.2 or Y330C, Y330A or F333I mutant Kir6.2 displayed punctate TRITC-BTX labeled channels (left panel, red, scale bar 10 μm, images were contrast enhanced for better visualization due to low expression level of Kir mutants). Co-localization with the fluid phase marker FITC-BSA (middle panel, green) in cells labeled with both fluorophores confirms the intracellular nature of channels (see merged pictures and insets, right panel). Note not all cell membranes were brightly labeled with FITC-BSA especially membranes at the cell-cell contact sites likely because FITC-BSA could not access this space. Also, only cells transfected with the channel subunits were labeled with TRITC-BTX. (C) Analysis of protein expression in COSm6 cells transfected with FLAG- or BTX tag-SUR1 with WT or mutant Kir6.2. Western blot of Kir6.2 shows reduced protein levels for both Y330C and F333I mutant Kir6.2 compared to WT whether the co-expressed SUR1 is tagged with a FLAG-epitope or BTX tag. Western blot of SUR1 shows reduced complex glycosylated form (upper band) when it is co-expressed with mutant Kir6.2. (D) Quantitative chemiluminescence assay shows surface expression of mutant channels was reduced by approximately 50%. (E) Monitoring endocytosis by surface biotinylation. COSm6 cells expressing WT or mutant KATP channels were labeled at 4°C and chased at 37°C for 30min. Residual surface label was cleaved to allow for Western Blot detection of internalized channels only (stripped, 0min control and 30min, right). Unstripped samples served as control to account for the total amount of channels present at the 0min and 30min time points (unstripped, left). Internalization of WT and Y330C mutant channels was similar over a 30min time interval when normalized to the total amout of surface label present at 0min (compare 30min stripped samples to 0min unstripped samples). (F) Quantification of biotinylated WT and mutant KATP channels by densitometry (n=4). The percentage of surface channels internalized at 30min was not significantly different between WT SUR1/ KIR6.2 (31.8±4.7%) and SUR1/ Kir6.2-Y330C (36.6±8.7%).

