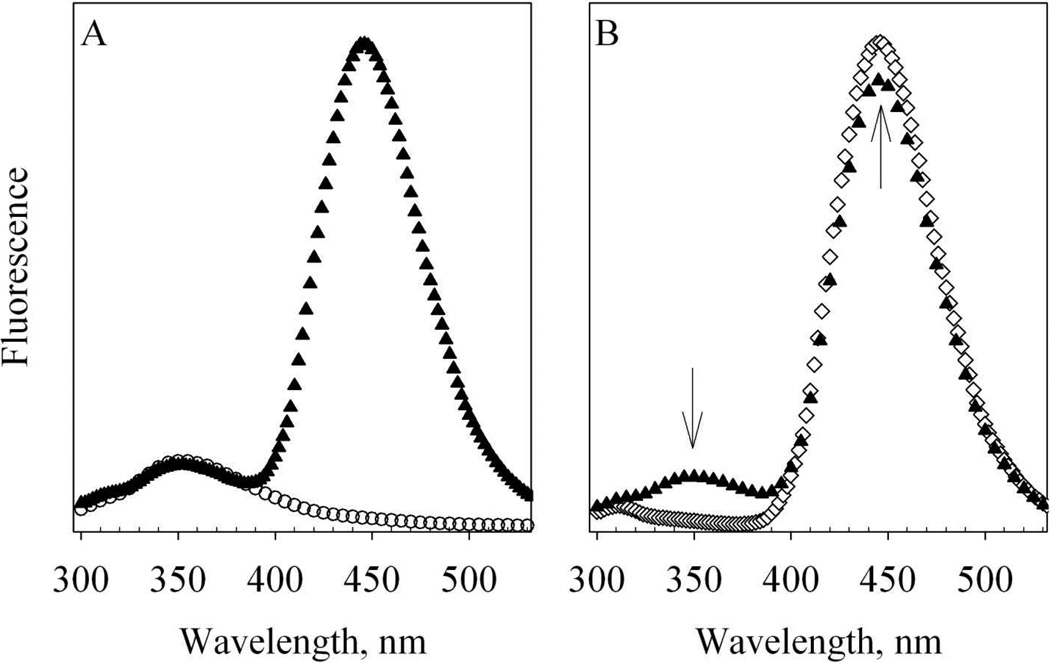
Figure 3. Fluorescence spectra of T34C/T110W CaM and Alexa-CaM.
A. 1.3µM apo T34C/T110W CaM (open circles) and 1.3µM apo Alexa-CaM (solid triangles) at room temperature. Buffer: 50 mM HEPES, pH 8.0 with 100µM EDTA. B. 1.3µM holo Alexa-CaM in 50 mM HEPES, pH 8.0 with 100µM EDTA (solid triangles) and mixed with 5.8 µM eNOS492–511 and 300 µM CaCl2 (open diamonds) at room temperature. Each spectrum is the average of two scans and the fluorescence intensities are in arbitrary units. The arrows stand for the changes of fluorescence.

