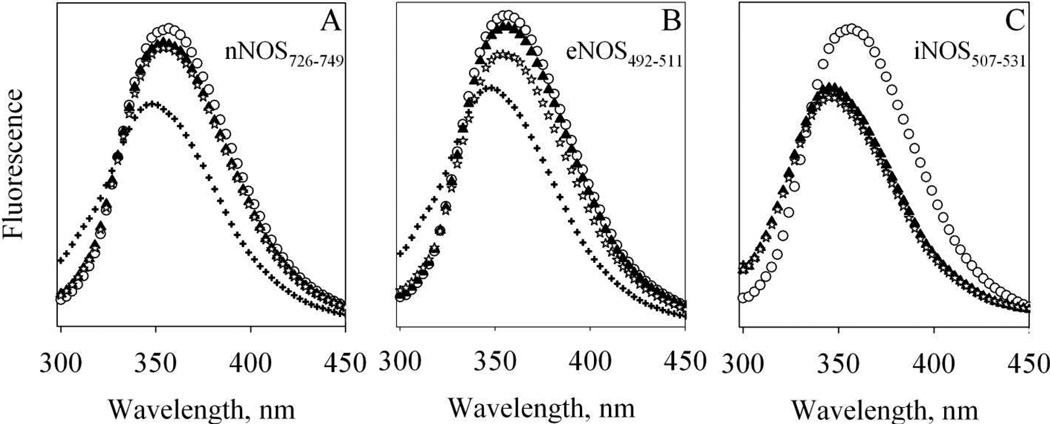
Figure 4. Fluorescence of T34C/T110W CaM and its complexes with NOS target peptides.
Each spectrum is the average of two scans obtained at room temperature and the fluorescence intensities are in arbitrary units. Buffer: 50 mM HEPES, pH 7.8 with 100 mM NaCl and 50 µM EDTA. 8.7µM Apo T34C/T110W CaM (open circles) was first mixed with (A) 39.3 µM nNOS726–749 (B) 35.3 µM eNOS492–511 or (C) 31 µM iNOS507–531 (solid triangles); then mixed with 450 µM CaCl2 (plus) and finally mixed with 4 mM EDTA (stars).

