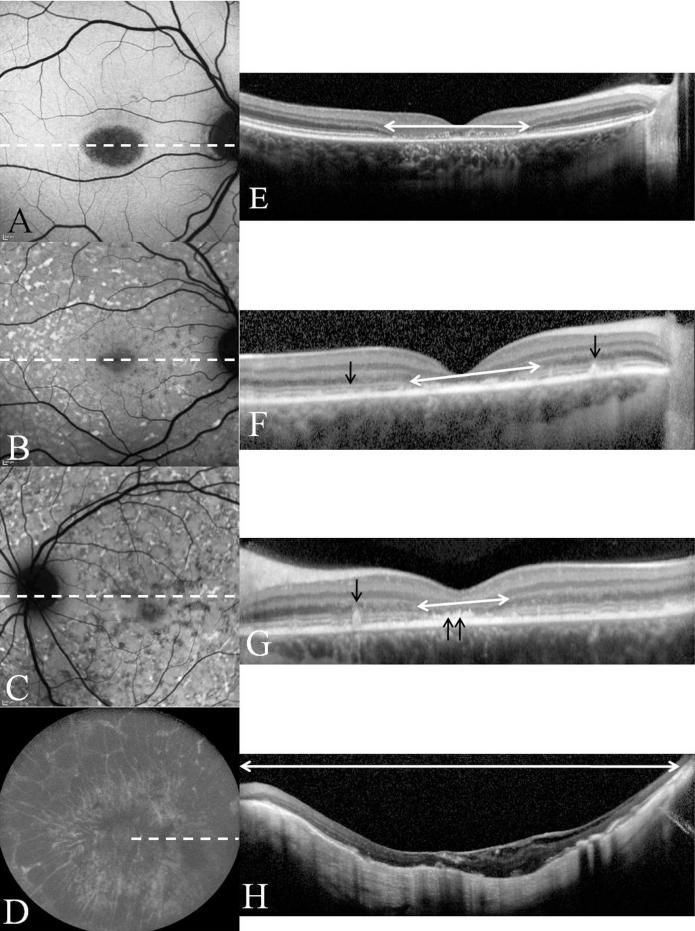
FIG. 4.
Images A-D are the FAF images corresponding to the fundus photos seen in figure 2. Corresponding SD-OCT line scans E-H are presented also. Their position on the FAF image is indicated by the white dashed lines. White double headed arrows indicate regions of absence of ISOS. Black arrows point to flecks as seen on SD-OCT as elevations from the RPE. Double arrows in image G point to abnormal thickening of the RPE in the parafoveal region. Image C clearly demonstrates a ring of uniform fluorescence in the peripapillary area consistent with peripapillary sparing. In image D we see marked RPE atrophy in the fundus including the peripapillary area i.e. peripapillary atrophy. 152×199mm (300 × 300 DPI)

