
Fig. 3.
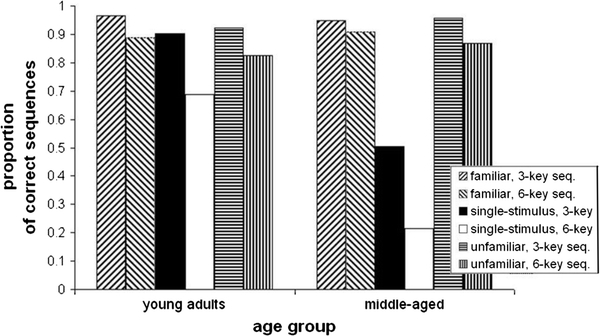
The mean proportions of correctly completed sequences across participants of each age group in the familiar, single-stimulus, and unfamiliar conditions of the test phase as a function of sequence length
Official websites use .gov
A
.gov website belongs to an official
government organization in the United States.
Secure .gov websites use HTTPS
A lock (
) or https:// means you've safely
connected to the .gov website. Share sensitive
information only on official, secure websites.
The mean proportions of correctly completed sequences across participants of each age group in the familiar, single-stimulus, and unfamiliar conditions of the test phase as a function of sequence length