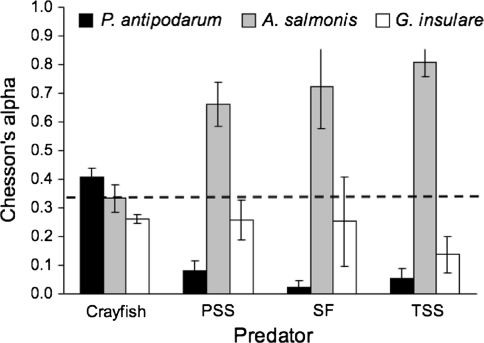
Fig. 3.
Predator preference (Chesson’s α) for three invertebrate prey species: P. antipodarum (P), A. salmonis (A), and G. insulare (G), mean ± 1SE, n = 5. Crayfish showed a preference for P. antipodarum (ANOVA, F 1,18 = 97.2, P < 0.0001) while Pacific staghorn sculpin (PSS), starry flounder (SF), and threespine stickleback (TSS) fish showed a preference for A. salmonis (ANOVA, F 1,18 = 15.15, P = 0.0011). Dashed line indicates no preference (α = 0.33 for each of three species)

