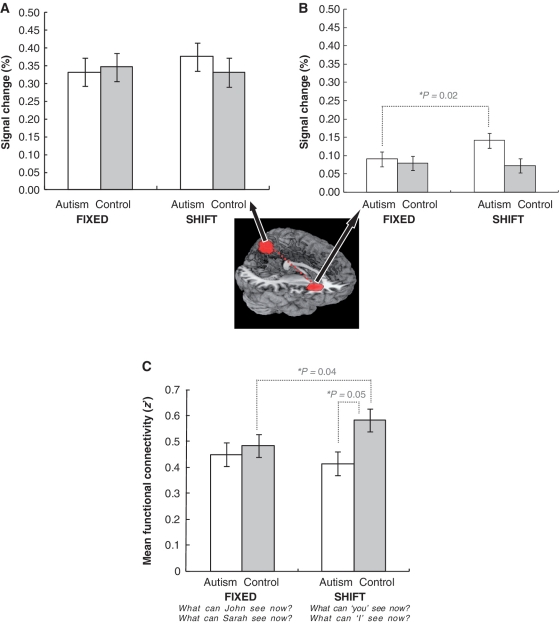
Figure 3.
FIXED versus SHIFT. Per cent signal change in the precuneus (A) and right anterior insula (B). Functional connectivity between the right anterior insula and precuneus (C). The error bars represent the 95% confidence interval for the within-subject effect in each condition. The image (centre) indicates the location of the region of interest (radius = 12 mm) for the precuneus [0, −64, 50] and right anterior insula [32, 26, 6] on the MNI coordinates.

