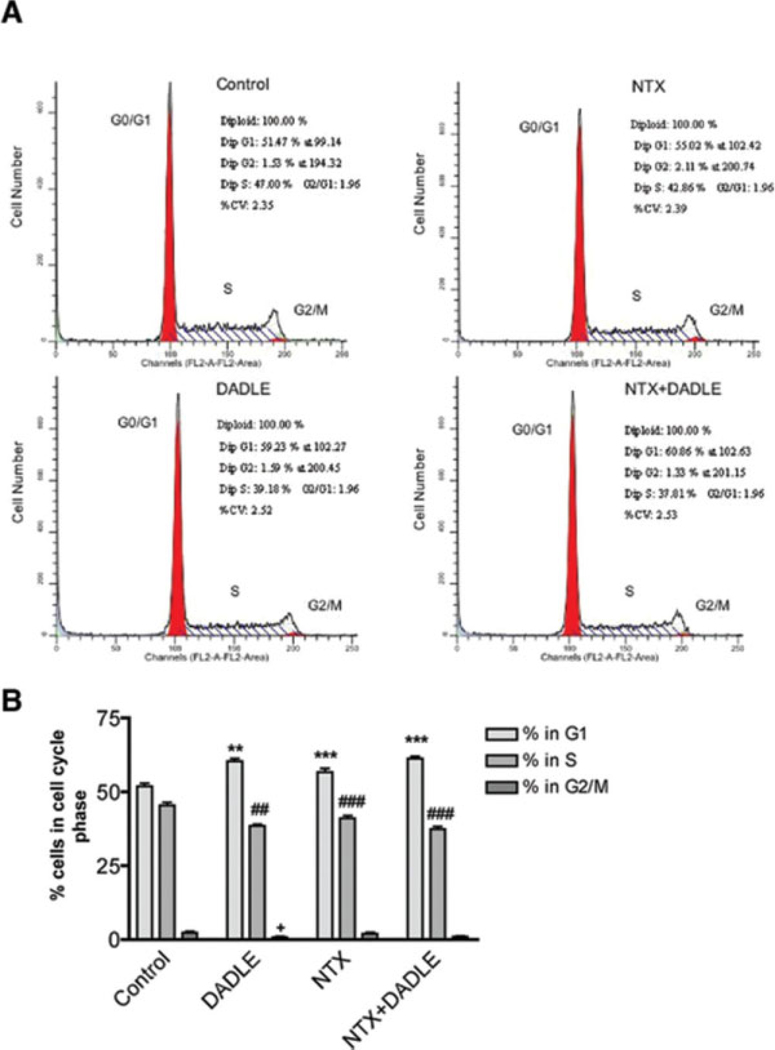
Fig. 3.
Cell cycle progression regulated by DADLE and naltrexone. (A) Flow cytometry analysis of DNA contents in AF5 cells. AF5 cells were plated in T75 tissue culture flasks at a density of 106 cells per flask. Cells were then synchronized by replacing the culture medium with a serum-free medium for 24 h. At the end of the 24 h, DADLE, naltrexone, or DADLE plus naltrexone, respectively, were added to the cells and cells were maintained in 0.5% FBS medium for an additional 24 h before assayed for the cell cycle progression analysis using the fluorescence-activated cell-sorter (FACS). The control cells received only the 0.5% FBS medium. DADLE, cells received 10−10 M of DADLE; NTX, cells received 10−10 M of naltrexone; NTX + DADLE, cells received a combination of 10−10 M of DADLE and 10−10 M of nlatrexone. (B) Summary of the results of six independent FACS determinations. The percentage of cells in different phases of the cell cycle is included in each treatment condition. **P < 0.01 and ***P < 0.001 compared to the control group in G1 phase; ##P < 0.01 and ###P < 0.001 compared with the control group in S phase; and +P < 0.05 compared with the control group in G2/M phase.

