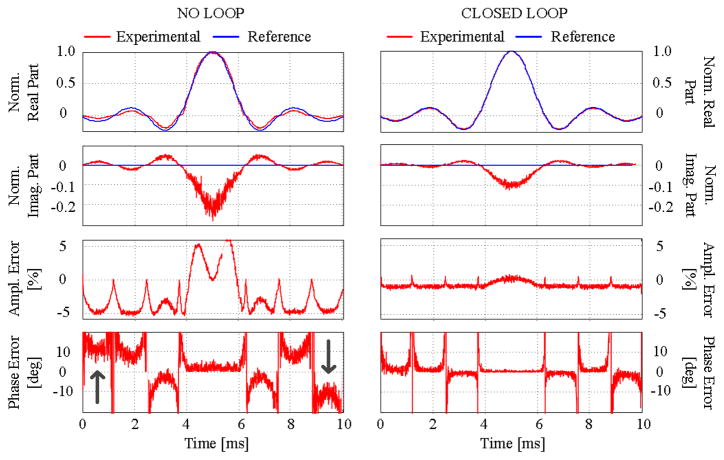
Fig. 10.
Amplitude and phase distortion of a Sinc pulse: comparison between reference signal and measured signal obtained with the power amplifier driven directly (left) and with the same amplifier after addition of the FOCF control loop (right). The first two upper panels show real and imaginary parts of the signal; the bottom two, amplitude and phase errors. The arrows point to memory effects in the phase error plot before feedback linearization is applied.

