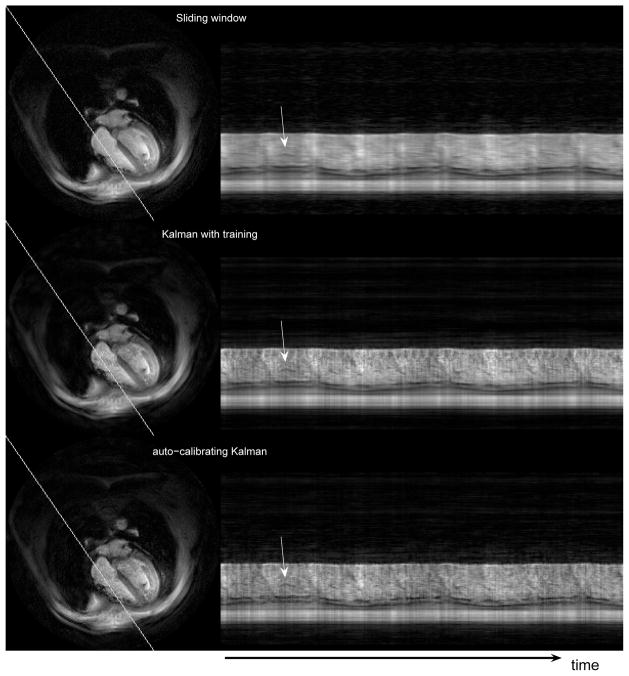
Figure 3.
Temporal variation of the oblique line shown on the left side for the three reconstructions. The pixels on the oblique line are arranged vertically in the profile images. The arrows point to a certain flap of the cardiac valve. Note that the profiles are not periodic due to breathing and ungated acquisitions.

