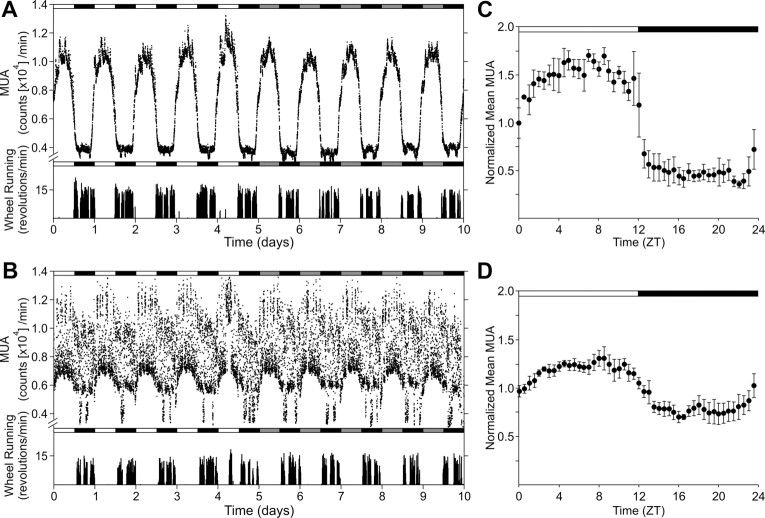
Figure 2.
Reduced MUA rhythm in the SCN of middle-aged mice in vivo. Representative serial-plotted actograms of neural and locomotor activity showing diurnal and circadian rhythms of MUA in the SCN of young (A) and middle-aged (B) mice. Lighting conditions are indicated at the top of the figure; open bars are light phases and closed are dark. Bottom trace represents simultaneous recorded locomotor activity. The number of spikes for MUA or activity counts for locomotor activity was counted every minute. C, D, Integrated mean activities were plotted for the LD condition. Each of four individual recordings was normalized with 24 h moving average and integrated for each group. Data are shown mean ± SEM, n = 4 per group.

