Fig. 1.

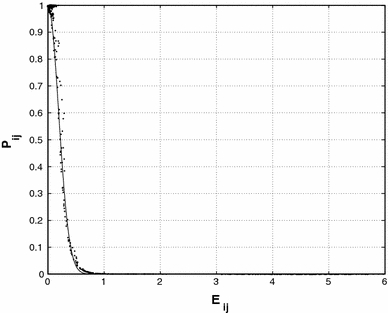
Typical form of the distribution function P ij versus energy E ij for an arbitrary node j. The drawn curve is a Gaussian function fitted to the data points

Typical form of the distribution function P ij versus energy E ij for an arbitrary node j. The drawn curve is a Gaussian function fitted to the data points