Fig. 16.

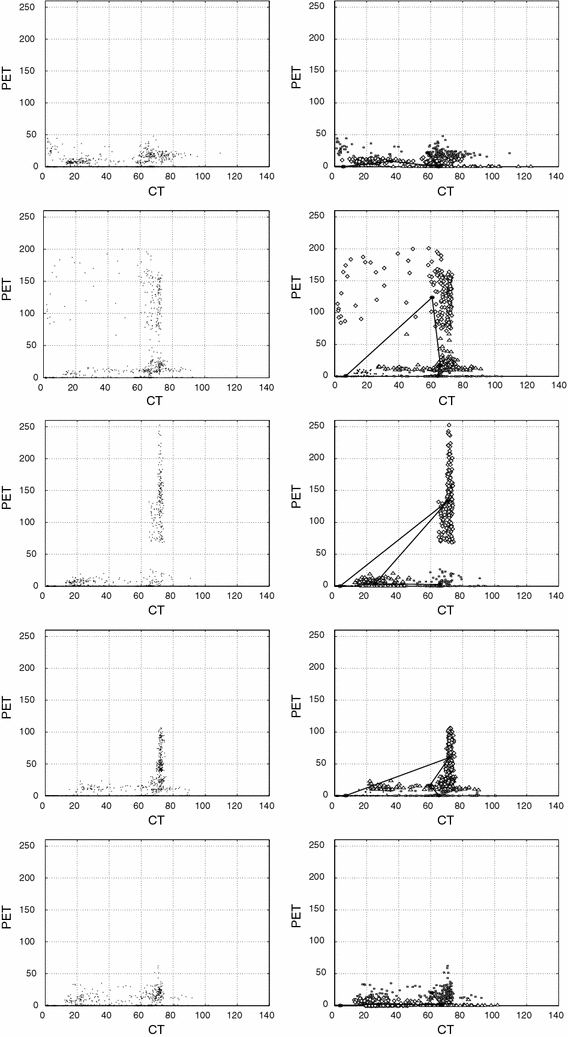
The 5 CT–PET cluster diagrams (first column), decomposition in 4 subclusters of the 5 CT–PET clusters together with the corresponding chain of 4 nodes (second column). The subclusters are marked with different symbols

The 5 CT–PET cluster diagrams (first column), decomposition in 4 subclusters of the 5 CT–PET clusters together with the corresponding chain of 4 nodes (second column). The subclusters are marked with different symbols