Fig. 18.

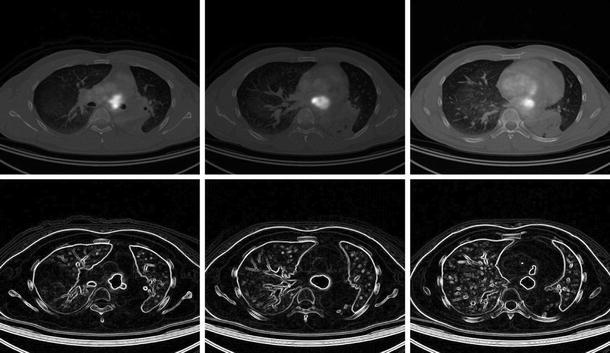
The superposed CT–PET images for slices 150, 160, and 170 (first row), images of the complementary clusters for slices 150, 160, and 170, treated with imageJ to show edges (second row)

The superposed CT–PET images for slices 150, 160, and 170 (first row), images of the complementary clusters for slices 150, 160, and 170, treated with imageJ to show edges (second row)