Fig. 6.

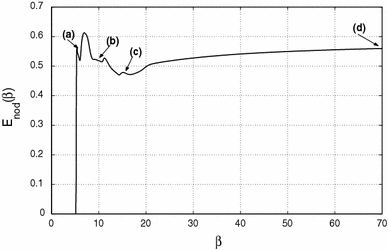
Node interaction energy E nod as a function of β for cluster C1.The arrows indicate the phases a, b, c, d for data registrations

Node interaction energy E nod as a function of β for cluster C1.The arrows indicate the phases a, b, c, d for data registrations