Fig. 7.

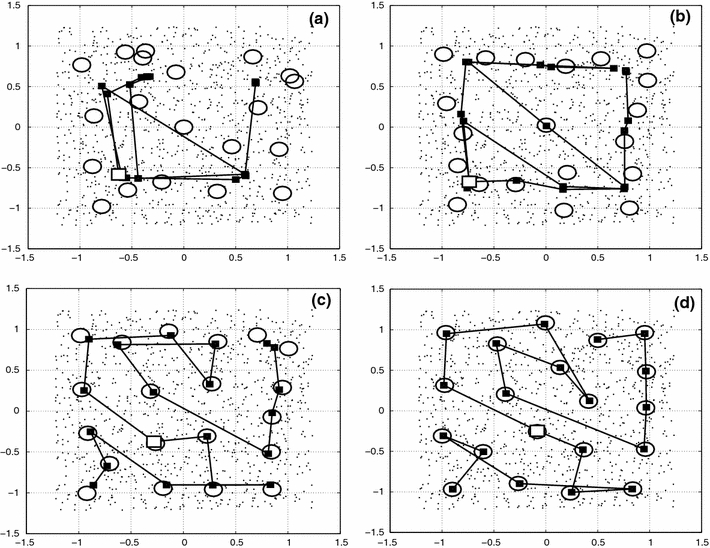
Data points (dots), nodes (filled rectangles), and hard centroids (circles) for phases a, b, c, d of cluster C1. The node 8 is marked in every phase by a square unfilled symbol

Data points (dots), nodes (filled rectangles), and hard centroids (circles) for phases a, b, c, d of cluster C1. The node 8 is marked in every phase by a square unfilled symbol