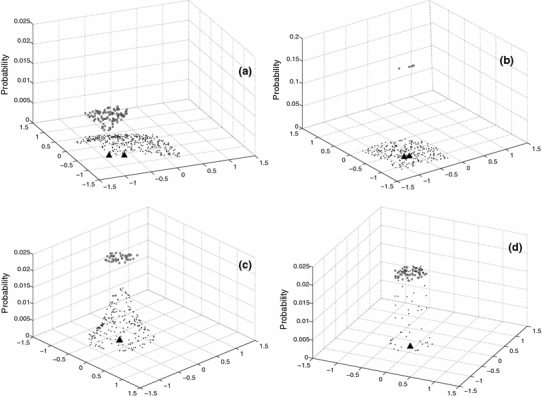
Fig. 9.

Probability distribution for the phases a, b, c, d for the fuzzy and hard subcluster of node 8 of cluster C1. The node position of subcluster 8 for every phase is shown in Fig. 7 by a square unfilled symbol. For phase b, much higher values for the probability-axis are necessary to note the data points of the hard cluster. Node—and hard centroid’s positions (filled triangles) are clearly separated in phases a and b but cannot be distinguished in phases c and d
