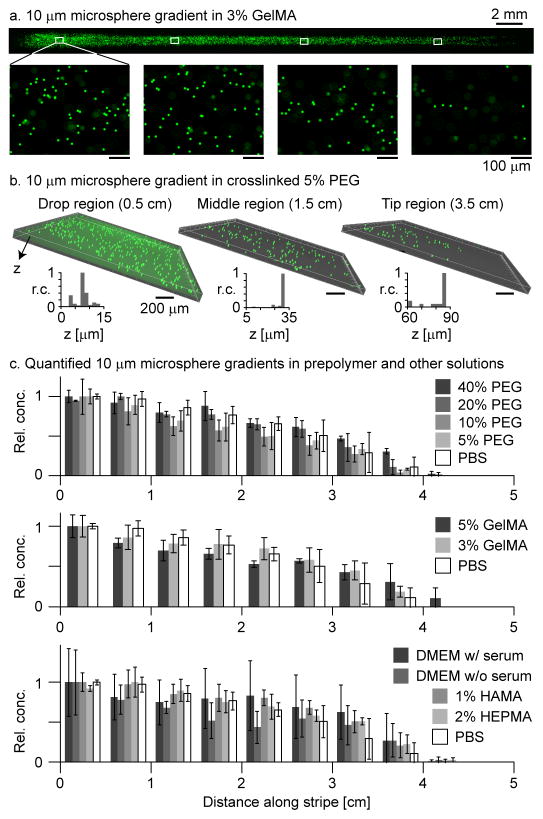
Figure 4.
Microsphere gradients in prepolymer solutions. (a) Fluorescence images of a 10 μm microsphere gradient in 3% GelMA. 2X microscope images indicate the overall gradient profile, while the 10X zooms below indicate the 3D positioning of the particles (microspheres out of focus were above or below the focal plane). (b) Inverted confocal microscope images quantify the vertical distribution of particles near the beginning, middle, and tip of a 10 μm microsphere gradient in 5% PEGDM 1000. Following generation of the particle gradient, the prepolymer stripe was crosslinked to fix the particles in their respective vertical positions. Histograms summarize the vertical positioning of the particles in the central regions of the confocal images (defined in Fig. S4) relative to the position of the lowest particle detected. (c) 10 μm microsphere gradients were produced in various prepolymer and other solutions and then quantified by fluorescence microscope. Bar charts summarize the normalized and laterally averaged microsphere counts along each gradient. Error bars indicate the standard deviation over three repetitions. The observed variation was due to the relatively low microsphere concentration; there was not a statistically significant difference between most of the data series. Scale bars: (a) 100 μm and (b) 200 μm, except where noted.

