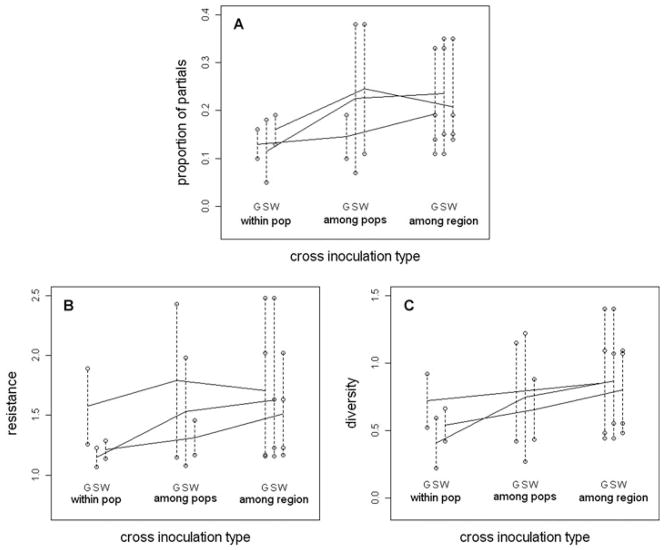
Figure 2.
(A) Proportion of partial resistances, (B) average resistance scores, and (C) diversity of resistance scores (Shannon–Weaver index, see text) for cross-inoculations using lines from within populations (two per region), from among populations (two different populations within each region), and among regions (lines from each region are tested against those from two other regions, in reciprocal combinations of the host and pathogen, giving four sets of cross-inoculations for each region). S, G, and W identify the regions (northern Kiandra Plain, southern Kiandra Plain, and Wild Horse Plain, respectively). Open circles are means for each set of cross-inoculations, and the dotted lines joining them identify the same region.

