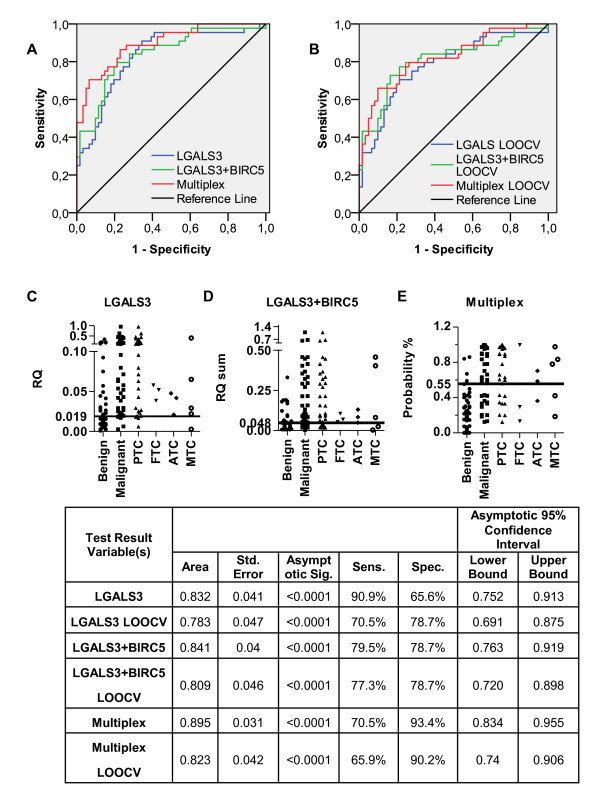
Figure 2.
The diagnostic performance of the best individual marker, two-marker set and multiplex biomarker model. A and B represents ROC curves of the best individual marker, two-marker set and multiplex model and their LOOCV ROC curves, respectively. C, D, E - Scatter dot plot of LGALS3 RQ, LGALS3 and BIRC5 RQ sum and Multiplex model with the best cut off shows how many benign nodules, malignant nodules and thyroid cancer subtypes are misclassified. In table are the best individual marker, two-marker set and multiplex biomarker model and their LOOCV model ROC curve AUC data and sensitivity and specificity at the best cut-off point.

