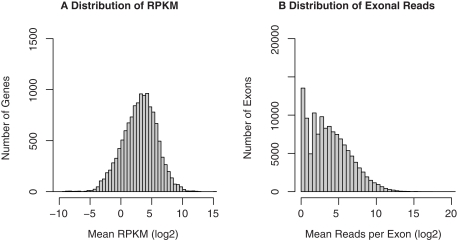
Figure 4.
RNA-seq gene expression profiles of GABAergic neurons projecting from nucleus accumbens shell to ventral pallidum. The same RNA samples used in the microarray study were amplified before “bar-coded” cDNA libraries were prepared for SOLiD sequencing. All four samples were then pooled and sequenced in the same run. The 50-bp sequencing reads were mapped to the rat reference genome and known splicing sites using the SHRiMP and TopHat programs, respectively. Gene expression levels (normalized to RPKM) were obtained using the Cufflinks program. A total of 11,000 unique RefSeq genes and 100,000 unique exons were detected. The distribution of mean RPKM for these genes (A) and exons (B) was plotted.

