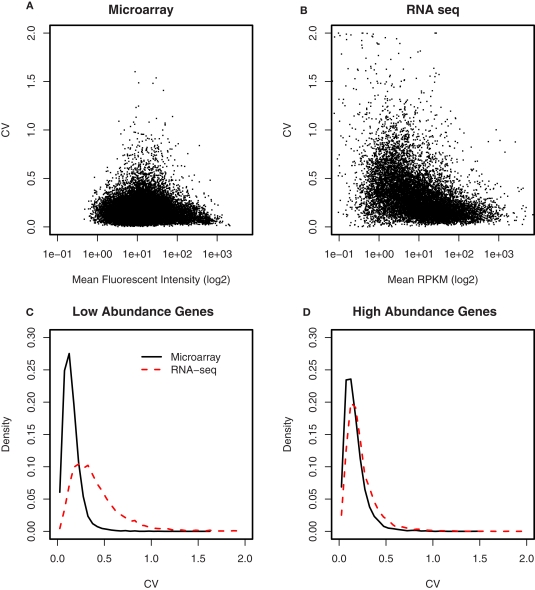
Figure 7.
Comparison of the variances between microarray and RNA-seq. (A) The coefficient of variation for each gene was plotted against its signal intensity obtained from microarray. (B) The coefficient of variation for each gene was plotted against its signal intensity obtained from RNA-seq. (C) The distribution of the CVs for low abundance genes showed microarray has less genes with high CVs (e.g., greater than 0.2) than RNA-seq. (D) The distribution of the CVs for high abundance genes were similar between microarray and RNA-seq. These data suggest that the samples size of RNA-seq experiments need to be the same or larger (for low abundance genes) than those of microarray experiments.

