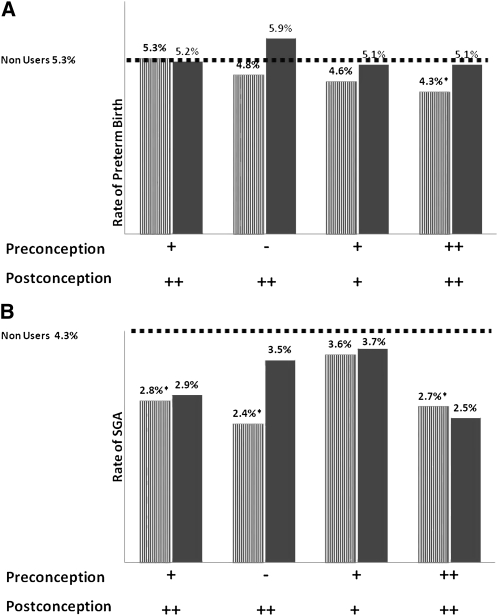
FIGURE 2.
Rates of preterm (A) or small-for-gestational-age (SGA) (B) births according to patterns of periconceptional multivitamin (striped bars) and folate-only use (gray bars) compared with nonusers (dashed line). For each 6-wk preconception or postconception period: +, partial use (1–3 wk of use); ++, regular use (4–6 wk of use); -, no use. *Comparison of preterm birth rate was significantly different from that of nonusers, P < 0.05 (crude Cox regression results).

